http://www.dplot.com/triangle-plot.htm
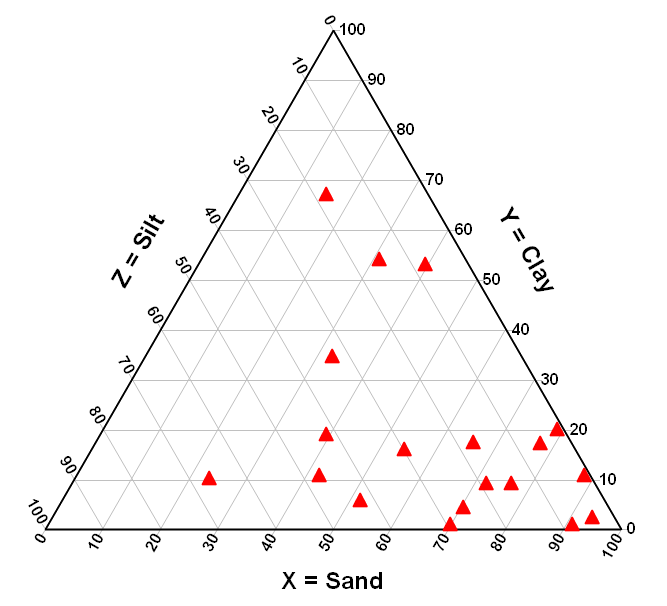
Triangle plots graph 3 variables, with the proportions of each variable summing to a constant. This means that any one variable is not independent of the others and because of this, only 2 variables must be known to find a point on the graph. Usually, the constant sums to 100%. In this triangle plot, each data point within the triangle represents a sample of soil and the proportions of its components, whether sand or clay or silt.
No comments:
Post a Comment